Introduction
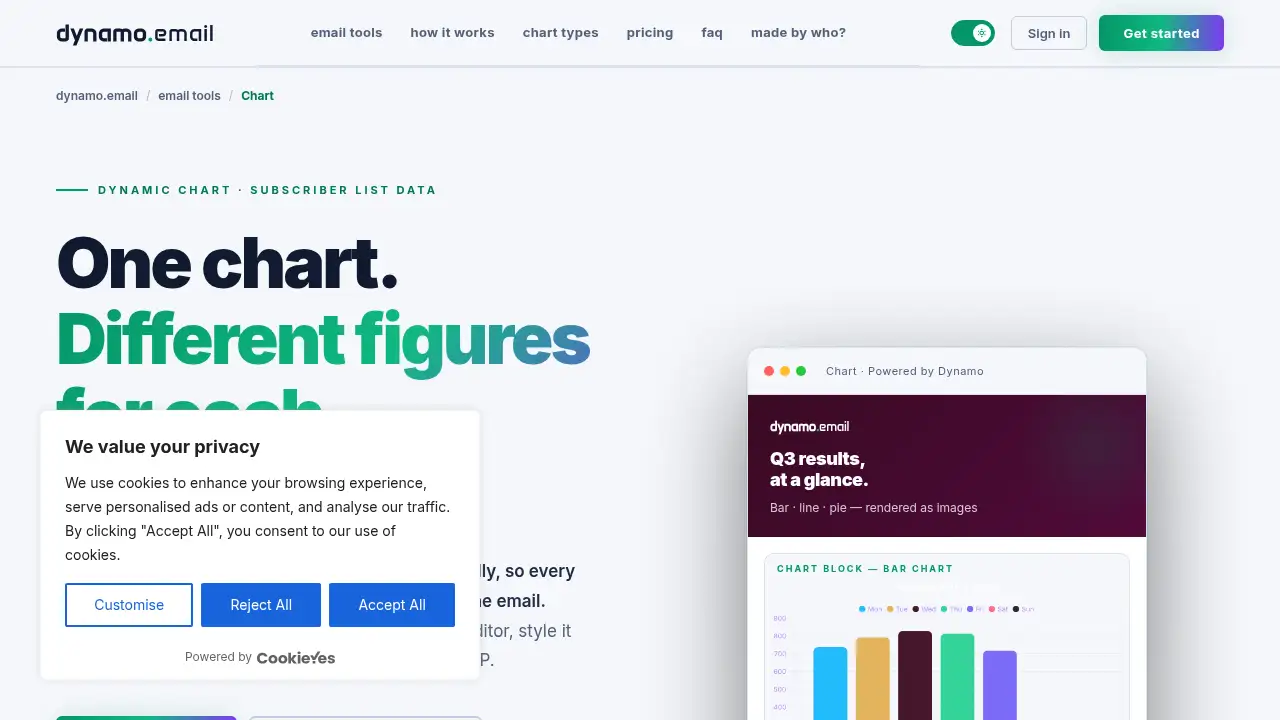
Chart for email by dynamoemail turns subscriber data into a live chart image that renders at open time. Instead of pasting a static screenshot, marketers build a dynamic chart in a live editor, style it to their brand, and let merge tags fill in each recipient's own figures automatically.
What is Chart for email by dynamoemail?
Chart for email by dynamoemail is a chart-building tool made specifically for the inbox. Most email charts are flat images exported from a spreadsheet or a dashboard, which means the numbers are frozen the moment the image is created. Chart takes a different approach: it generates a chart image from a hosted URL, and that URL can include your email service provider's merge tags. When a subscriber opens the email, the chart renders with that subscriber's own list data.
The product solves a common reporting problem. A monthly investor update, a usage summary, or a billing notification usually shows the same static figure for everyone on the send, or requires a separate export for each segment. With a dynamic chart built in the live chart editor, one image can display different numbers for every person on the list, with no separate integration and no batch exports.
It matters because email clients are restrictive environments. Scripts, embedded widgets, and interactive elements are stripped out or blocked, so charts must arrive as images. Chart is designed around that constraint: it renders as an image, but the numbers behind it stay tied to subscriber data through merge tags. That combination makes personalized email charts practical for teams that send from Klaviyo, Mailchimp, HubSpot, or any other ESP.
Key Features of Chart for email by dynamoemail
Live Chart Editor
Build a chart and watch the preview update as you type. The editor shows the result in real time, so there is no exporting, screenshotting, and re-checking cycle before sending.
Per-Subscriber Personalization with Merge Tags
Drop your ESP's merge tags into the chart URL and each subscriber's email renders their own figures at open time. This is the core of the dynamic chart workflow, and it requires no separate data pipeline.
Bar, Line, and Pie Chart Types
Choose from common chart types to compare campaigns, regions, quarters, or trends at a glance. Each type is edited in the same interface, so switching formats is quick.
Image Rendering for Every Inbox
Charts are delivered as images rather than scripts or embedded objects. That means they display in email clients without broken embeds or blocked content.
On-Brand Styling
Set colors, labels, and layout to match your campaign. The preview reflects the final image, so data looks designed rather than pasted in from a spreadsheet.
One Hosted URL for Any ESP
Paste a plain hosted chart image URL for a single shared chart, or add merge tags for personalized versions. The same URL structure works across email platforms, including Klaviyo, Mailchimp, and HubSpot.
Use Cases for Chart for email by dynamoemail
Finance and Reporting Updates
Monthly and quarterly numbers become readable in a single glance. Insert merge tags so stakeholder and investor emails always show the latest figures rather than last month's export.
SaaS Usage and Billing Emails
Each user can receive a chart of their own usage or billing data. The dynamic chart renders at open time, so there is no need for per-user batch exports or manual screenshots.
Newsletters and Editorial Data Stories
Illustrate a point with a bar chart or line chart instead of a paragraph of numbers. Editors can build a chart in minutes and keep the styling consistent across issues.
Agency Client Reports
Produce consistent, on-brand charts for every client send. A single template with merge tags can serve multiple accounts without rebuilding the visual each time.
How to Use Chart for email by dynamoemail
- Pick a chart type. Start with a bar, line, or pie chart in the live chart editor and enter your numbers.
- Style the chart. Adjust colors, labels, and layout to match your brand or campaign design.
- Choose your data mode. Use the plain hosted URL for one shared chart, or insert your ESP's merge tags so Chart for email renders each subscriber's own list data.
- Copy the image URL. Paste it into your email template wherever the chart should appear.
- Send and check. Because the image renders at open time, the same template can show different figures for different recipients.
Target Audience for Chart for email by dynamoemail
- Email marketers who send recurring performance or account updates
- Finance and reporting teams producing investor or stakeholder emails
- SaaS companies sending usage, billing, or account summaries
- Newsletter and editorial teams illustrating data stories
- Agencies managing on-brand client reports across multiple accounts
- Developers and ops teams looking for a simple hosted chart image URL
Is Chart for email by dynamoemail Free?
Chart offers a free plan with no time limit and no card required, plus a flat-rate paid plan. Usage-based fees may apply for high-volume use.
| Plan | Price | Features |
|---|---|---|
| Free | $0 | Live chart editor, unlimited generations, custom colors and labels, works with any ESP, "Powered by Dynamo" watermark on all assets |
| Pro | $99/year per product + VAT if applicable | Everything in Free, no watermark, priority email support |
Chart for email by dynamoemail's Pros and Cons
| Aspect | Pros | Cons |
|---|---|---|
| Pricing | Free plan with no time limit; flat annual fee with no per-seat charges | Pro is a yearly commitment, and VAT may apply |
| Features | Per-subscriber data via merge tags, live preview, custom styling | Chart types are focused on bar, line, and pie rather than a large library |
| Compatibility | Works with any ESP through a hosted image URL | Requires basic familiarity with merge tags for personalization |
| Branding | Full color and label control for on-brand output | Free plan output carries a visible watermark |
| Setup | No separate integration or batch exports needed | High-volume usage may add fees |
Frequently Asked Questions about Chart for email by dynamoemail
What chart types can I build?
The editor supports common formats such as bar, line, and pie charts, which cover most reporting and comparison needs. You can edit the data and styling in the same interface and see the result live.
How does the chart show different numbers for each subscriber?
You add your email service provider's merge tags to the chart image URL. When the email is opened, Chart for email reads whatever list data the ESP fills in for that subscriber and renders the chart with those figures.
Will the chart display in every email client?
Charts are rendered as images, so they appear in email clients without scripts or embedded objects. That image-based approach is what makes the chart reliable across different inboxes.
Does it work with Klaviyo, Mailchimp, or HubSpot?
Yes. Any ESP that supports merge tags and image URLs can be used, including Klaviyo, Mailchimp, and HubSpot. You paste the hosted URL into your template and let your ESP handle personalization.
Can I send one shared chart instead of personalized data?
Yes. Paste the plain hosted chart image URL without merge tags to send one shared visual to the whole list. This suits announcements, editorial pieces, or reports where everyone should see the same numbers.
Is there a watermark on free charts?
Free accounts can generate unlimited charts, but every image includes a small "Powered by Dynamo" watermark. Upgrading to Pro removes it and adds priority email support.
Chart for email by dynamoemail Tags
Chart for email, dynamic chart, personalized email charts, email chart tool, merge tags, live chart editor, hosted chart image, subscriber data, bar chart email, line chart email, pie chart email, dynamoemail