Introduction
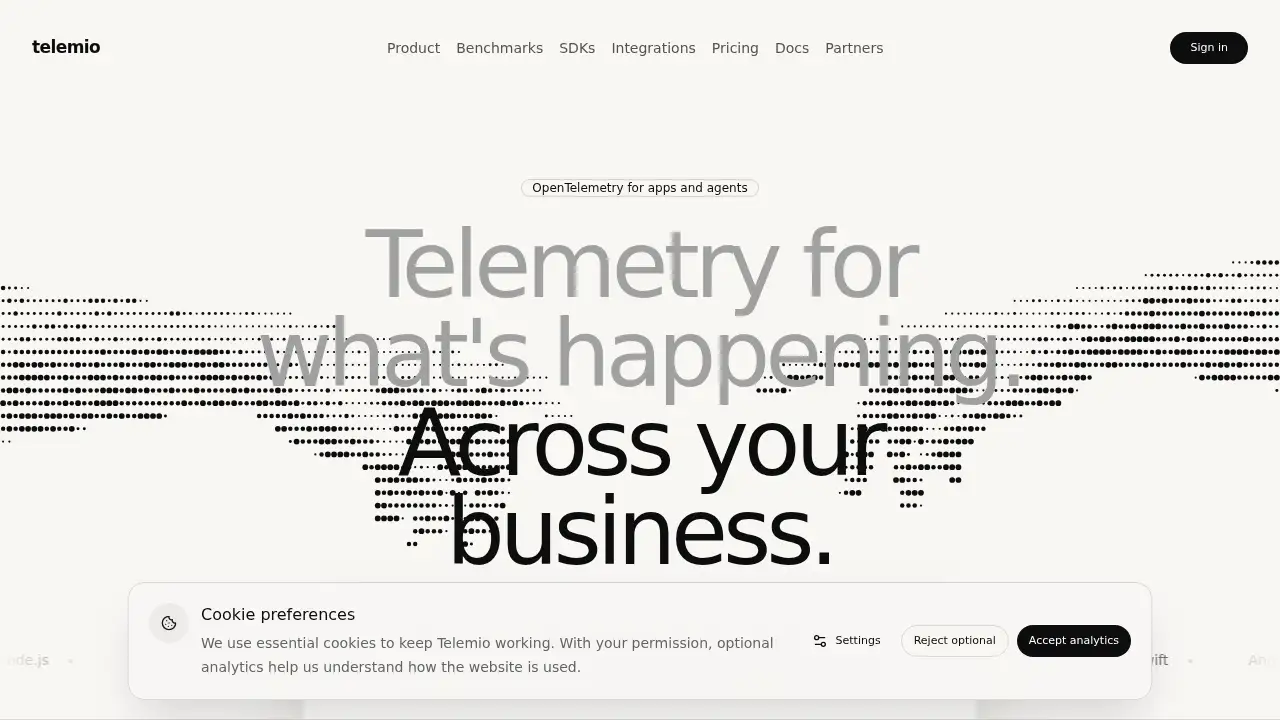
Telemio observability platform connects your telemetry.
What is Telemio?
The Telemio observability platform is a connected telemetry observability tool for applications, services, browsers, mobile clients, infrastructure, and AI agents. It solves a common visibility problem: logs, browser errors, model calls, deploys, and infrastructure signals often describe the same incident but do not share context. Telemio links those signals back to the application, release, dependency, session, or agent run they belong to.
It is suitable for teams that run distributed software and want full-stack observability without rebuilding their app. Telemio supports OpenTelemetry observability paths, so teams can keep existing instrumentation and add shared context across services, browsers, mobile apps, infrastructure, and agent runtimes. This matters because modern businesses run on connected systems, and visibility should be connected too.
Key Features of Telemio
Unified Telemetry View
Connect traces, logs, metrics, RUM, product events, infrastructure signals, and agent operations in one workspace. Use the Telemio observability platform to follow a request across services instead of checking each system in isolation.
OpenTelemetry Integration
Send telemetry directly with OpenTelemetry or fan out from a Collector. Keep standard OpenTelemetry flows and add connected telemetry context across services, native apps, and agentic runtimes.
AI Agent Observability
Track model calls, tools, handoffs, retries, token use, context reuse, and agent runs alongside application work. The metadata-first approach supports AI agent observability without requiring teams to store every prompt or completion.
Release and Dependency Correlation
Tie browser errors, slow requests, deploys, queues, databases, and cloud services to the same release. This supports application performance monitoring and infrastructure monitoring with useful runtime context.
Free Viewer Seats
Let stakeholders view telemetry without paying for every viewer seat. Paid seats are for people who configure and operate the workspace, while paid plans include operator seats and a monthly telemetry allowance.
CLI, API, and MCP Server
Use api.telemio.sh for control and queries, the Telemio CLI for local workflows, and mcp.telemio.sh as a workspace-scoped companion for coding agents. These options help technical teams fit the Telemio observability platform into existing workflows.
Enterprise Controls
Support SAML/OIDC SSO, SCIM lifecycle management, organization controls, auditability, and access policies. Larger organizations can discuss negotiated ingestion, retention, security reviews, and deployment architecture.
Use Cases for Telemio
Troubleshoot Checkout Failures
Trace a failed checkout through the request, queue, database, deploy, and payment service. Connected telemetry helps teams find where the business flow broke and which dependency was involved.
Monitor AI Agent Workflows
Follow model calls, tool use, handoffs, retries, and agent runs in context. This makes AI agent observability part of full-stack observability rather than a separate silo.
Improve Mobile and Web Experience
Connect a slow screen or broken interaction to the API call, release, and infrastructure behind it. Use application performance monitoring with real user session context to prioritize fixes.
Manage Cloud Infrastructure
See resource pressure, topology changes, and deploys alongside the applications they affect. Support infrastructure monitoring across hosts, Kubernetes, and data services without losing application context.
Validate Releases
Compare telemetry before and after a deploy. Use the Telemio observability platform to see which build, service, or feature change was active when an issue appeared.
How to Use Telemio
- Choose a setup path. Use a repository-aware coding agent prompt, install the Telemio CLI, add
@telemio/sdkin trusted JavaScript/TypeScript runtimes, or point an existing OpenTelemetry pipeline at Telemio. - Configure the app. Set service identity and choose standard OpenTelemetry instrumentation for browsers, mobile apps, JVM services, backend services, workers, or agentic runtimes.
- Verify telemetry. Confirm that traces, logs, metrics, RUM, product events, infrastructure signals, and agent operations arrive in the Telemio observability platform.
- Connect context. Link releases, dependencies, sessions, and agent runs so users can follow one request across services.
- Review and adjust. Use usage alerts and limits to stay within budget, and invite free viewers to review telemetry.
Target Audience for Telemio
- Engineering and platform teams running distributed applications and services.
- SRE, DevOps, and infrastructure teams that need infrastructure monitoring and dependency context.
- AI and ML teams building agentic runtimes and needing AI agent observability.
- Mobile and web product teams that want application performance monitoring and session context.
- Organizations adopting OpenTelemetry observability or migrating from existing telemetry tools.
- Enterprise teams with SSO, SCIM, audit, security, and procurement requirements.
Is Telemio Free?
Telemio uses traffic-based plans. Paid plans include operator seats and a monthly telemetry allowance, while viewer seats are free. The Free plan requires no card, and usage alerts and limits help teams manage budgets.
| Plan | Price | Features |
|---|---|---|
| Free | $0 | Free viewer seats, usage warnings and limits, no card required |
| Paid | Traffic-based | Operator seats, monthly telemetry allowance, usage alerts and limits |
| Enterprise & Strategic | Custom | Negotiated ingestion and retention, SAML/OIDC SSO, SCIM, organization controls, security reviews, capacity options |
Telemio's Pros and Cons
| Aspect | Pros | Cons |
|---|---|---|
| Pricing | Free viewer seats and traffic-based paid plans | Telemetry-volume pricing can be harder to predict |
| Features | Unified view across apps, infrastructure, browser, mobile, and AI agents; OpenTelemetry compatibility | Custom pipelines may require OpenTelemetry knowledge |
| Deployment | Works beside existing systems and supports enterprise controls | Advanced enterprise terms require written agreement and sales discussion |
| AI telemetry | Metadata-first agent observability without storing prompts | Agent-specific depth depends on instrumentation choices |
Frequently Asked Questions about Telemio
What is the Telemio observability platform?
The Telemio observability platform is a connected telemetry observability tool for application, service, browser, mobile, infrastructure, and agent telemetry. It helps teams see how these signals relate instead of investigating each system separately.
Does Telemio work with OpenTelemetry?
Yes. Telemio supports OpenTelemetry directly and through a Collector. Teams can keep standard OpenTelemetry flows and add the Telemio observability platform for shared context across services, browsers, mobile apps, infrastructure, and agent runtimes.
Can Telemio monitor AI agents without storing prompts?
Yes. Agent telemetry is metadata-first. Teams can track model calls, token use, cost, tools, handoffs, retries, outcomes, and fingerprints without storing prompts or completions. This supports AI agent observability while reducing sensitive data exposure.
Are viewer seats really free?
Yes. Viewer seats are free, and paid seats are for people who configure and operate the workspace. Paid plans include operator seats and a monthly telemetry allowance, with usage alerts and limits.
Can Telemio send telemetry to other systems?
Yes. Telemio uses OpenTelemetry and is being built to route data through OTLP, object storage, Kafka, warehouses, and other observability tools. This helps teams avoid a closed telemetry pipeline.
How does Telemio pricing work?
Telemio uses traffic-based plans. Paid plans include operator seats and a monthly telemetry allowance. Usage alerts and limits help teams stay within budget, and the Free plan requires no card.
Telemio Tags
Telemio observability platform, connected telemetry, telemetry observability, OpenTelemetry observability, AI agent observability, full-stack observability, application performance monitoring, infrastructure monitoring, observability platform, distributed tracing, RUM, agent telemetry