Introduction
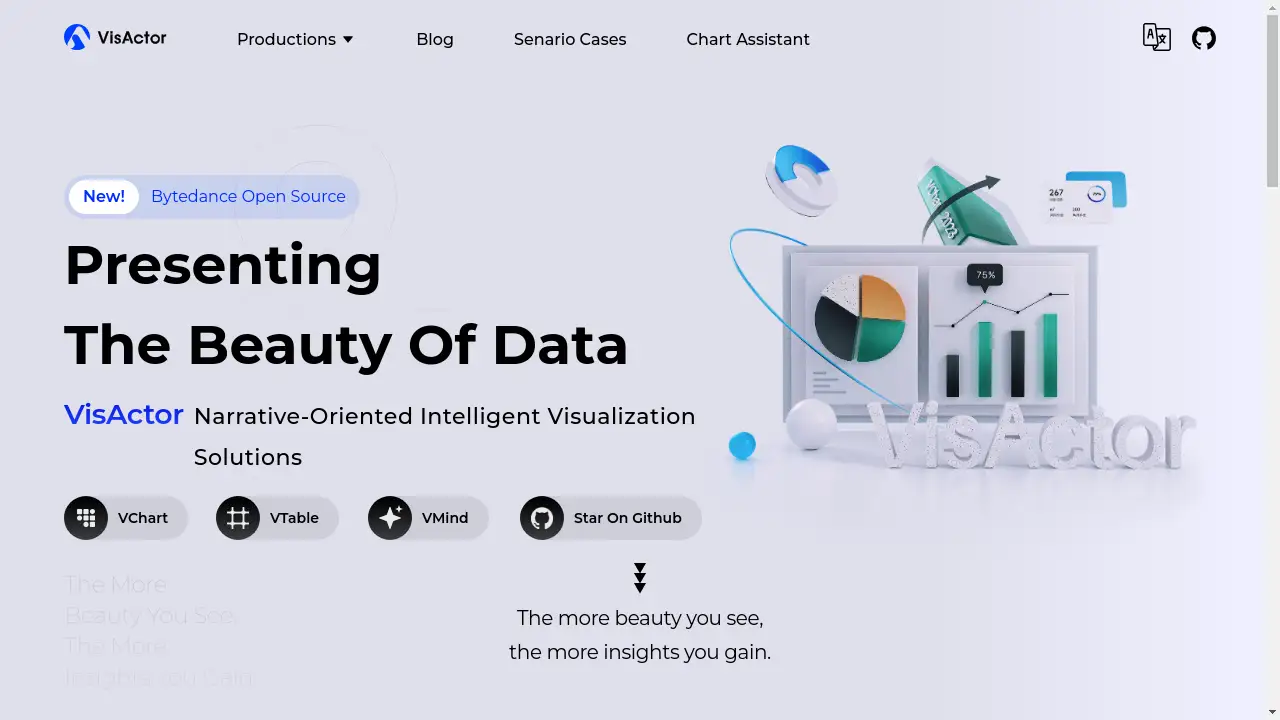
VisActor is an open-source, narrative-oriented intelligent visualization solution for creating data stories.
What is VisActor?
VisActor is a comprehensive suite of open-source data visualization tools designed to transform complex data into clear and compelling visual narratives. Originating from the extensive visualization needs of ByteDance, this solution tackles the challenge of making data not only understandable but also engaging for a wide range of audiences. It is suitable for developers, data analysts, and businesses looking to integrate advanced data visualization capabilities into applications like business intelligence dashboards, large-screen displays, and office suites. The platform's focus on narrative visualization sets it apart, aiming to tell a story with data rather than just presenting static charts. By combining a robust visualization grammar with intelligent automation, VisActor provides a complete toolkit for modern data analysis and presentation.
Key Features of VisActor
Multi-Module Solution
VisActor is not a single tool but a cohesive ecosystem of specialized modules, including a rendering engine, chart and table components, and GIS capabilities, which work together to provide a complete intelligent visualization solution.
VChart Story Teller
This multi-terminal chart library offers a wide variety of out-of-the-box chart types and is designed to function as a flexible data storyteller, enabling the creation of dynamic and animated data narratives.
VTable Checkered Artist
VTable acts as a high-performance, multi-dimensional data analysis table that combines powerful data handling with sophisticated visual design, turning simple spreadsheets into artistic grid-based visualizations.
VGrammar Data Magician
As the core visualization grammar of the suite, VGrammar provides the foundational building blocks for generating thousands of different chart types, offering immense flexibility for custom visual creation.
VRender Visual Rendering
This is the underlying rendering engine that powers the entire suite, providing a versatile and high-performance toolset for rendering complex visual elements across different platforms.
VMind Smart Visualization Suit
VMind introduces an element of automation to the process, using intelligent algorithms to help generate visualizations, moving beyond simple automation to create insightful and "fantastic" data representations.
VStory Data Story Framework
This framework is specifically designed for narrative visualization, providing a structured way to build and present data-driven stories that guide the audience through insights.
Use Cases for VisActor
Large Screen Visualization
VisActor is ideal for creating immersive data dashboards and large-screen displays, leveraging rich chart types, dynamic animations, and excellent rendering performance to build compelling data experiences for command centers or presentations.
Business Intelligence (BI)
In BI scenarios, the platform's customizable chart styles, layouts, and built-in data analysis capabilities allow businesses to create tailored visualizations that meet diverse reporting and analytical needs.
Office Suite Integration
The tools offer good compatibility and performance across various end environments, making them suitable for embedding advanced data visualization directly into office applications and productivity suites.
Graph Visualization
With dedicated components for graph and network visualization, VisActor can effectively display complex relationships and interconnected data, which is valuable for social network analysis or infrastructure mapping.
How to Use VisActor
Getting started with VisActor involves a straightforward process centered around its modular architecture.
- Explore the Modules: Visit the official VisActor website to understand the different components available, such as VChart for charts, VTable for tables, and VMind for intelligent features.
- Review Documentation and Demos: Check the provided documentation and scenario cases to see practical examples of how each module can be applied to different visualization challenges.
- Integrate into Your Project: As an open-source solution, developers can integrate the specific VisActor libraries (e.g., VChart, VTable) directly into their web or application projects using standard package managers.
- Utilize the Chart Assistant: For a guided experience, the Chart Assistant tool can help users select appropriate chart types and configurations based on their data.
- Develop and Customize: Leverage the powerful VGrammar module for highly customized chart creation or use the VStory framework to build sequential, narrative-driven data presentations.
Target Audience for VisActor
- Front-end and application developers building data-driven applications.
- Data Scientists and Analysts who need to create interactive reports and dashboards.
- Business Intelligence (BI) professionals and teams.
- Product managers and designers focused on user experience and data presentation.
- Organizations requiring high-performance, large-screen visualization solutions.
Is Visateur Free?
VisActor is an open-source project, which means its core libraries and tools are available for free. Users can access, use, and modify the code under its open-source license, making it a cost-effective solution for both personal and commercial projects. There is no mention of premium tiers, suggesting a generous free plan that provides access to the full suite of visualization solutions, from the rendering engine to the intelligent components.
Frequently Asked Questions about VisActor
What is the main goal of VisActor?
The main goal of VisActor is to provide a comprehensive, narrative-oriented intelligent visualization solution that helps users transform raw data into engaging and insightful visual stories, going beyond traditional charting.
Is VisActor suitable for beginners in data visualization?
While some modules like the Chart Assistant offer a more guided experience, VisActor is a powerful, developer-centric toolkit. A solid understanding of web technologies and data concepts is beneficial for leveraging its full potential.
What kinds of charts can I create with VChart?
VChart supports a wide range of conventional and advanced chart types, enabling the creation of everything from basic bar and line charts to more complex visualizations suitable for dynamic storytelling.
How does VisActor handle large datasets?
Components like VTable are specifically designed as high-performance tables for multi-dimensional data analysis, indicating that the suite is built to handle and visualize large volumes of data efficiently.
Can I use VisActor for real-time data visualization?
Yes, the platform's capabilities for dynamic data updates and excellent multi-chart rendering performance make it a strong candidate for projects requiring real-time data feeds, such as live dashboards.
What is the difference between VGrammar and VChart?
VGrammar is the underlying visual grammar that provides the low-level building blocks for creating custom charts, while VChart is a higher-level, ready-to-use chart library built upon VGrammar for faster development.
VisActor Tags
VisActor, data visualization, narrative visualization, intelligent visualization, visualization solutions, VChart, VTable, VGrammar, open source, data analysis, chart library, data storytelling, business intelligence