Introduction
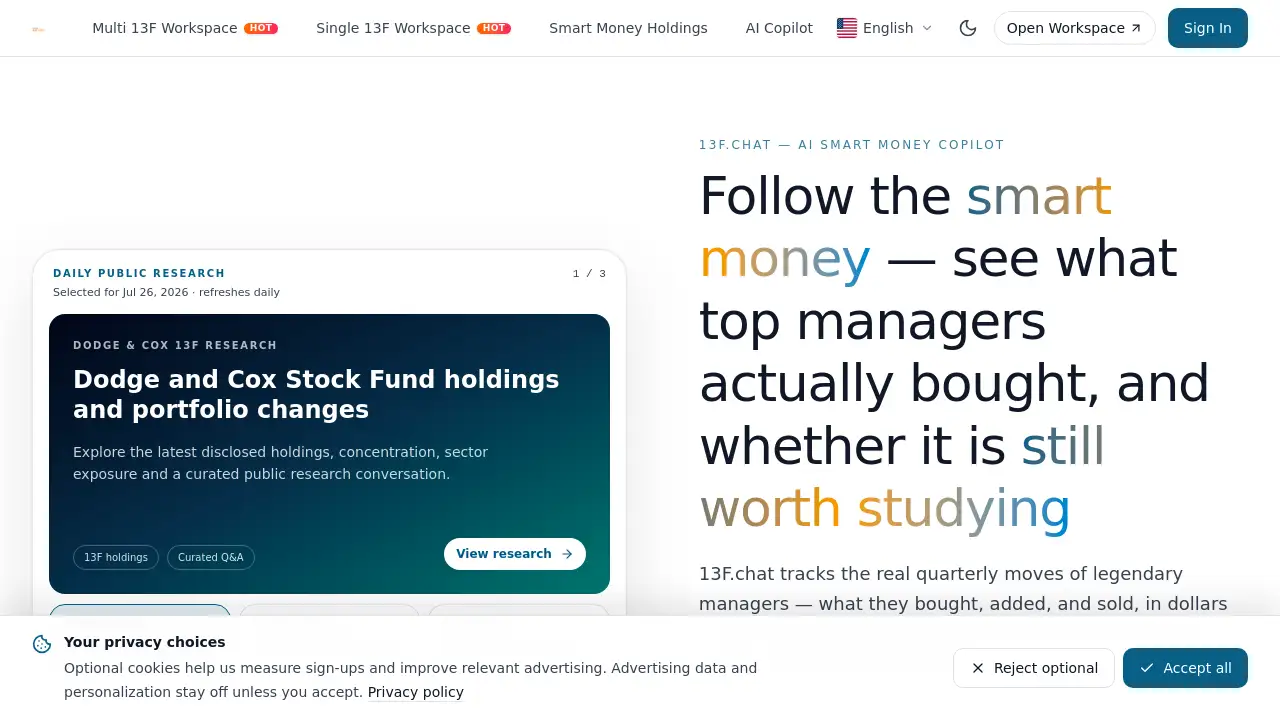
13F.chat transforms complex SEC 13F filings into actionable investment intelligence, making hedge fund tracking accessible for every investor. This tool helps users follow the moves of billion-dollar managers, understand their estimated costs, and leverage AI to explain why these smart money decisions matter. By turning regulatory data into clear signals, 13F.chat simplifies the process of monitoring institutional activity.
What is 13F.chat?
13F.chat is a specialized platform that processes SEC 13F filings—quarterly reports that large institutional investment managers must file with the Securities and Exchange Commission. These filings reveal what stocks the most successful hedge funds and asset managers bought, sold, or held. The platform converts this dense regulatory data into visual dashboards, real-time rotation signals, and AI-powered explanations.
The core problem 13F.chat solves is information overload. Reading raw 13F filings is time-consuming and requires financial expertise. This tool aggregates data from hundreds of managers, ranks their best ideas by conviction, and highlights capital rotation across industries. It is designed for retail investors, financial analysts, and anyone who wants to follow the "smart money" without spending hours manually parsing PDFs.
Why does this matter? Institutional investors often have access to better research and market insights. By tracking their disclosed holdings, individual investors can gain a similar edge. 13F.chat provides a structured, up-to-date snapshot of where the most sophisticated capital is flowing, making investment analysis more democratic.
Key Features of 13F.chat
13F Discovery Radar
This feature scans the latest SEC 13F filings for rotation signals. It shows how much active capital moved in or out of the market, broken down by managers, industries, and stocks. The radar displays real-time figures, such as the latest flow of -$70B, giving users a macro view of institutional sentiment.
Capital Rotation Timeline
A stacked visual chart that displays sector-level capital flow, compared against the SPY benchmark. This feature helps users see which sectors are gaining or losing institutional money over time. For example, the latest data shows Financials, Health Care, and Information Technology experiencing net outflows, while a withdrawal proxy tracks the broader market shift.
Macro Rotation Heatmap
This heatmap ranks all industries by current 13F exposure and colors them by active flow momentum. Users can quickly spot which industries are being "added" or "trimmed" by top managers. For instance, Software and Services show -$19B in active flow, while Energy is down -$16.8B, indicating clear sectors to avoid or investigate.
Highest Conviction Stock Moves
A table that lists individual stocks with the largest active capital flows and a "conviction" score. The conviction percentage shows how much of a manager's portfolio is committed to that stock relative to its typical weighting. Recent examples include Microsoft ( -$12B flow, 1.3% conviction ) and Alphabet ( +$8.3B flow, 1.1% conviction ).
Largest Manager Books
This feature profiles the biggest institutional filers. It displays their total AUM, turnover rate, and investment style (e.g., Large Cap Growth, Long-term Holder). Users can study the portfolio movements of firms like Berkshire Hathaway ( AUM +$263B ) or Fisher Asset Management ( AUM +$203B ).
Use Cases for 13F.chat
Monitor Hedge Fund Activity
Use the 13F Discovery Radar to see exactly which stocks top hedge fund managers are buying or selling in the most recent quarter. This provides a direct window into their current thinking and portfolio changes.
Identify Sector Rotation Trends
The Capital Rotation Timeline and Macro Rotation Heatmap allow users to spot which industries are attracting or losing institutional capital. This is useful for adjusting sector allocations in a personal portfolio.
Research Stock Ideas with High Conviction
The Highest Conviction Stock Moves table highlights stocks where managers have made significant bets relative to their portfolio. This helps generate ideas for further research, focusing on stocks with strong conviction signals.
How to Use 13F.chat
- Visit the website: Go to 13F.chat. The main dashboard loads immediately, showing the 13F Discovery Radar and aggregate data.
- Select a time range: Use the dropdown menus to compare 13F filings from different quarters (e.g., 2025-12-31 vs 2026-03-31) to see changes over time.
- Browse the overview: Review the total number of managers, industries, stocks tracked, and the latest active flow to get a macro picture.
- Explore visualizations: Click on the Capital Rotation Timeline or Macro Rotation Heatmap to see sector and industry details. Hover over data points for exact numbers.
- Check individual stocks and managers: Scroll to the Highest Conviction Stock Moves and Largest Manager Books sections to analyze specific positions and the top filers.
Target Audience for 13F.chat
- Retail Investors: Individuals who want to align their portfolio with institutional moves.
- Financial Analysts: Professionals who need quick, aggregated 13F data for client reports or market research.
- Traders: Short-term and long-term traders looking for conviction signals and rotation patterns.
- Finance Students and Educators: Learners who want to study institutional investment behavior through real-world data.
- Journalists and Media: Writers covering market trends who need verified institutional data points.
Is 13F.chat Free?
The reference information does not specify a pricing structure. Based on typical SaaS models for similar data tools, 13F.chat likely offers a free tier with basic access to the dashboard and limited historical data. A paid subscription may unlock deeper historical comparisons, export capabilities, and advanced filtering. For the most accurate and current pricing, users should check the official 13F.chat website for its pricing page.
| Plan | Price | Features |
|---|---|---|
| Free | $0 (likely) | Access to main dashboard, basic radar, and current quarter data. |
| Pro | Varies (likely) | Full historical data, advanced filters, data export, and AI analysis depth. |
13F.chat's Pros and Cons
| Aspect | Pros | Cons |
|---|---|---|
| Data Coverage | Tracks 133 managers and 500 stocks, providing broad market coverage. | Does not cover all 13F filers; focuses on the largest. |
| User Interface | Visual dashboards are intuitive and easy to navigate. | Initial data density might overwhelm new users. |
| AI Features | AI explanations help interpret raw data, saving time. | AI analysis depth is limited to available filing data. |
| Timeliness | Updates data with each new 13F filing cycle (quarterly). | Data is historical and not real-time; reflects past quarter positions. |
| Cost | Likely affordable or free for basic use. | Full-feature access may require a subscription. |
Frequently Asked Questions about 13F.chat
What are SEC 13F filings and why are they important?
SEC 13F filings are quarterly reports that all institutional investment managers with over $100 million in assets must file. They list the manager's long stock positions, helping investors see what the "smart money" is doing. 13F.chat makes these filings easy to understand.
How often is the data on 13F.chat updated?
The data updates every quarter, roughly 45 days after the end of each quarter. For example, the filings from March 31, 2026, would be available in May 2026. The platform displays the specific filing dates at the top of the dashboard.
Does 13F.chat cover international hedge funds?
No. 13F filings are required only from US-based institutional managers. The platform may include some international funds that file with the SEC, but its primary focus is on US-domiciled asset managers and hedge funds.
Can I use 13F.chat to copy a hedge fund's exact portfolio?
No. 13F filings only show long positions and do not include short positions, derivatives, or cash holdings. They are also delayed by up to 45 days. While useful for tracking smart money trends, they should not be used to blindly copy a fund's exact portfolio.
How does the AI explanation feature work?
The AI analyzes the changes in each manager's holdings and their conviction scores. It then generates a plain-language summary explaining the likely rationale behind the move, such as a sector rotation or a bet on specific growth drivers.
Is there an export function for the data?
The reference material does not confirm an export feature. Users who need to export data for offline analysis should check the platform's settings or upgrade to a paid plan if available.
13F.chat Tags
SEC 13F filings, hedge fund tracking, investment analysis, smart money tracking, AI stock analysis, institutional portfolio tracking, capital rotation, sector rotation analysis, 13F data dashboard, stock conviction score, manager book analysis, portfolio monitoring