Introduction
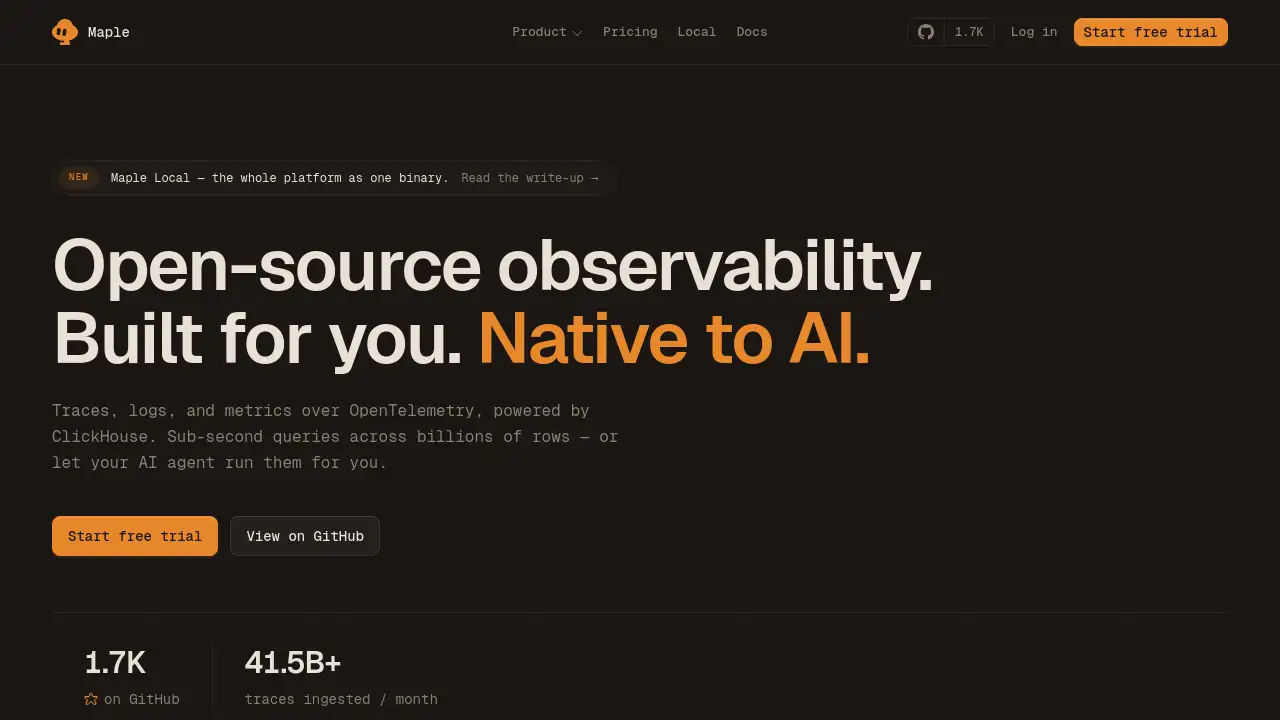
Maple is an open-source observability platform built on OpenTelemetry, designed for teams that need traces, logs, and metrics in one place. The Maple observability platform helps developers search distributed traces, replay user sessions, and use AI-powered diagnostics to find root causes faster. It combines a modern dashboard with an MCP server, giving engineers a connected view of their system. With native OTLP support, a local binary, and a self-host option, Maple offers a practical path for teams that want more control over their telemetry data.
What is Maple?
Maple is an open-source observability platform built on OpenTelemetry and backed by ClickHouse. It collects telemetry over OTLP and gives teams a single interface for traces, logs, and metrics. The Maple observability platform is designed for engineers who are tired of switching between separate monitoring tools when an incident happens. It connects every signal to the same trace ID, so a failing request can be followed from alert to span to log line without leaving the product. Because it offers AI-powered diagnostics through a built-in MCP server, it also helps developers analyze large datasets quickly. This matters because modern systems generate huge amounts of telemetry, and teams need a way to find the useful signal without losing context.
Key Features of Maple
The Maple observability platform offers the following core features.
OpenTelemetry-Native Ingestion
Maple accepts telemetry straight through OTLP and does not require a proprietary agent. This makes OpenTelemetry observability practical for teams that already use standard instrumentation or plan to migrate later.
Traces, Logs, and Metrics in One Place
Every request becomes a span tree with attributes intact, while structured logs remain searchable in seconds. The Maple observability platform connects distributed traces to logs and metrics under one interface, so engineers do not need to stitch context together manually.
AI-Powered Diagnostics
Maple includes a first-class MCP server, which lets AI agents list services, search traces, find errors, and propose fixes. These AI-powered diagnostics give teams a faster starting point for incident response.
Incident Correlation
Alerts arrive with service, threshold, and sample traces. A single trace ID links the alert, the failing span, and the relevant logs, so users can move from a 3 AM page to the line that caused it.
Session Replay
Maple records every click, route, console line, and failed request. Replay and spans share one session ID, which makes frontend and backend debugging easier.
Deployment Flexibility and Sovereignty
Maple can run as one binary on 127.0.0.1 or as a Helm chart on Kubernetes. Teams that need self-host observability can keep telemetry inside their network and control retention themselves.
Use Cases for Maple
Use Case 1: Debugging a Failed Request
When a service fails, the trace opens on the failing span and shows retries at the bottom. OpenTelemetry observability data keeps attributes intact, so engineers can see timeouts and service boundaries quickly. The Maple observability platform turns a span tree into a clear story instead of a pile of disconnected events.
Use Case 2: Correlating Alerts with Logs
An alert about error rate crosses its threshold and includes sample traces. On the Maple observability platform, the same trace ID is already attached to the relevant logs, so teams can skip the second search in a second tool.
Use Case 3: AI-Assisted Root Cause Analysis
With AI-powered diagnostics, an agent can read the telemetry, inspect the source behind a span, and propose a fix. This helps developers save time during incident investigations and reduces the need to jump between dashboards manually.
How to Use Maple
- Install Maple by running
brew install Makisuo/tap/mapleorcurl -fsSL https://maple.dev/cli/install | sh. - Run
maple startto launch the local platform on127.0.0.1:4318. - Point your OpenTelemetry services to Maple’s OTLP endpoint.
- Once data flows, the Maple observability platform lets you explore distributed traces, logs, and metrics in one dashboard.
- For Kubernetes, install the
maple-k8s-infraHelm chart to enrich spans with pod, node, and namespace data.
Target Audience for Maple
- SRE and DevOps teams that want unified telemetry.
- Backend and platform engineers using OpenTelemetry.
- Startups that need a predictable observability bill.
- Security-conscious teams that prefer self-host observability.
- Teams building AI agents that need access to telemetry.
Is Maple Free?
The Maple observability platform has both self-host and hosted options. You can run Maple locally without an account, and the cloud plan starts with a 14-day free trial.
| Plan | Price | Features |
|---|---|---|
| Self-Host | $0 | Maple binary, local OTLP ingest, no account or rate limits |
| Startup | $39/month | 100 GB logs, traces, and metrics each, flat $0.30/GB overage |
| Enterprise | Custom | Higher volume, custom retention, priority support |
Maple's Pros and Cons
| Aspect | Pros | Cons |
|---|---|---|
| Pricing | Simple per-GB model; no per-host or per-seat fees | Managed cloud has no permanent free tier |
| Open source | Source is available under FSL-1.1; self-hosting is supported | Releases become Apache 2.0 only after two years |
| OpenTelemetry | Native OTLP support; no proprietary agent | Teams must already use or adopt OpenTelemetry standards |
| AI features | First-class MCP server; agent can propose fixes | Requires an MCP-compatible agent |
| Deployment | One-binary local setup and Helm chart for Kubernetes | Large self-host installations need ClickHouse management |
Frequently Asked Questions about Maple
What is Maple?
The Maple observability platform is an open-source observability platform built on OpenTelemetry and backed by ClickHouse. It helps teams collect, visualize, and analyze distributed traces, logs, and metrics from services in one place.
Is Maple open source?
Maple’s source is on GitHub under FSL-1.1, so users can read every line, fork it, and self-host it. Each release becomes Apache 2.0 two years after publication.
Is Maple OpenTelemetry-native?
Yes. Maple uses OpenTelemetry observability standards and accepts OTLP directly. There is no proprietary agent, so existing OpenTelemetry data can be sent to Maple without re-instrumenting code.
How is Maple priced?
The Startup plan costs $39/month and includes 100 GB each of logs, traces, and metrics. Additional data is billed at a flat $0.30/GB, with no per-host or per-seat fees. A 14-day free trial is available for the hosted plan.
Does Maple work with AI agents?
Yes. Maple ships a first-class MCP server. Compatible agents can list services, search traces, find errors, and propose fixes using AI-powered diagnostics.
Can I self-host Maple?
Yes. The Maple observability platform supports self-host observability on user-controlled infrastructure. The local binary requires no account, and the Helm chart makes Kubernetes deployment easier.
Maple Tags
Maple observability platform, open-source observability, OpenTelemetry observability, distributed traces, AI-powered diagnostics, self-host observability, MCP server, ClickHouse observability, Kubernetes observability, session replay, incident correlation, logs metrics traces